Three Ways to View Azure Functions Error Logs
I recently posted about how I’d used Azure Functions to automate sending a daily tweet. One function runs at midnight and selects a random tweet from a list I have in OneDrive, and it then posts a scheduled message to a queue which sends the message at the appropriate time the next day.
It’s been working great, but last night it failed. So how can you find out what went wrong with your Azure Function?
In the Portal
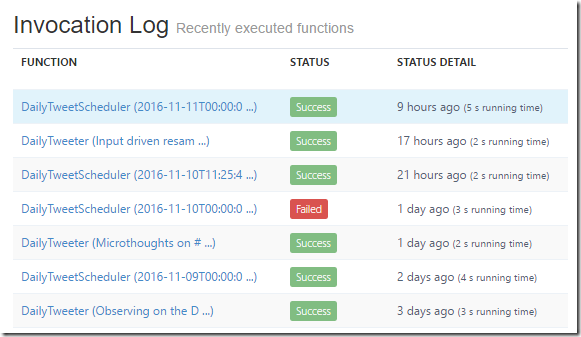
Well, the easiest way is to navigate to your function app in the portal, select the function, and go to the Monitor tab. In here we see a nice breakdown of when the function ran, and how long it ran for:
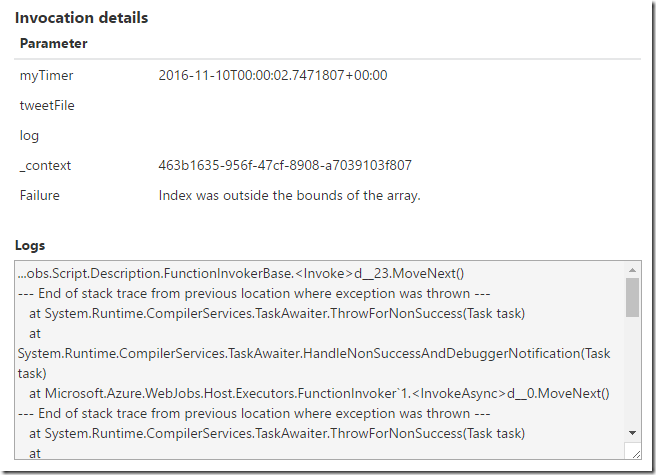
If we select the invocation that failed, then on the right-hand side we get to see the logs, and some useful information:
There is unfortunately an issue that the contents of the logs message box is sometimes truncated. However, a recent update to the portal also surfaces the exception message – here “Index was outside the bounds of the array”. That enabled me to track down a stupid mistake in my function and get it running again.
In KUDU
I also learned, thanks to Fabio Cavalcante, that there is a nice console in your function apps KUDU site. You get to that by navigating to https://myfunctionapp.scm.azurewebsites.net. Then you need to select Tools | WebJobs dashboard and then choose Functions.
You end up at https://myfunctionapp.scm.azurewebsites.net/azurejobs/#/functions. Which has a really nice dashboard showing you recent invocations:
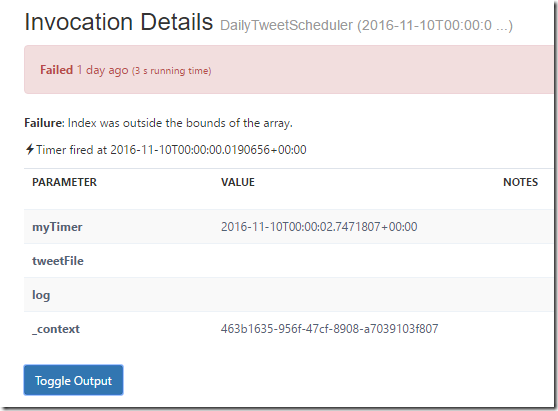
If we select the failed invocation, we get the same breakdown we saw in the portal:
Table Storage
The final thing worth pointing out, is that all the logging and timing information of your functions output is stored in the Storage Account that was created when you created your Functions App.
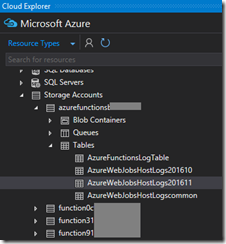
If you have the Azure SDK installed, then in Visual Studio you can browse to this in the Cloud Explorer window. (If you have multiple Azure Function Apps then it might be a bit tricky to remember which one belongs to which function app, but you can discover that by looking in your Application Settings at the contents of the AzureWebJobsStorage setting)
Here’s the storage account for my function app:
As you can see, there are a few tables in there, and a recent update to Azure Functions means that there is now a table per month, making it easier for you to discard old logs when you’re done with them.
This table contains a whole host of useful information, but we’re looking for rows with a RawStatus of CompletedFailure. And here we can see my failed function invocation with all the information about timing, the arguments, log output and error details:
Obviously for troubleshooting an individual issue, the portal or KUDU would be better, but it’s great to also have access to all the data in table storage in case you want to automate your own processes to look for errors or certain conditions and send yourself an alert (you could even write another Azure Function to do that!)
 A place for me to share what I'm learning: Azure, .NET, Docker, audio, microservices, and more...


Comments
All 3 places are using the same source behind the scenes: Table Storage. Unfortunately, if a function invocation outputs a large log entry, it gets truncated. It might happen e.g. in case of large exception stacktrace, or an output trace from a SQL stored procedure.
Mikhail ShilkovSo the 4th option is to go to App Settings -> Diagnostics logs and enable logging to Filesystem and/or Blob storage, where the full log will be available.
None of them seem to work anymore :(
Alisson Reinaldo SilvaThe recommendation now is to use Application Insights, although you can still enable the old monitoring if you want: https://docs.microsoft.com/...
Mark HeathI think I'm going to try using Application Insights, not sure if that would work with Python code, but I'll take a look. Thanks!!
Alisson Reinaldo Silva